Create a Change Detection App with GEE
Introduction
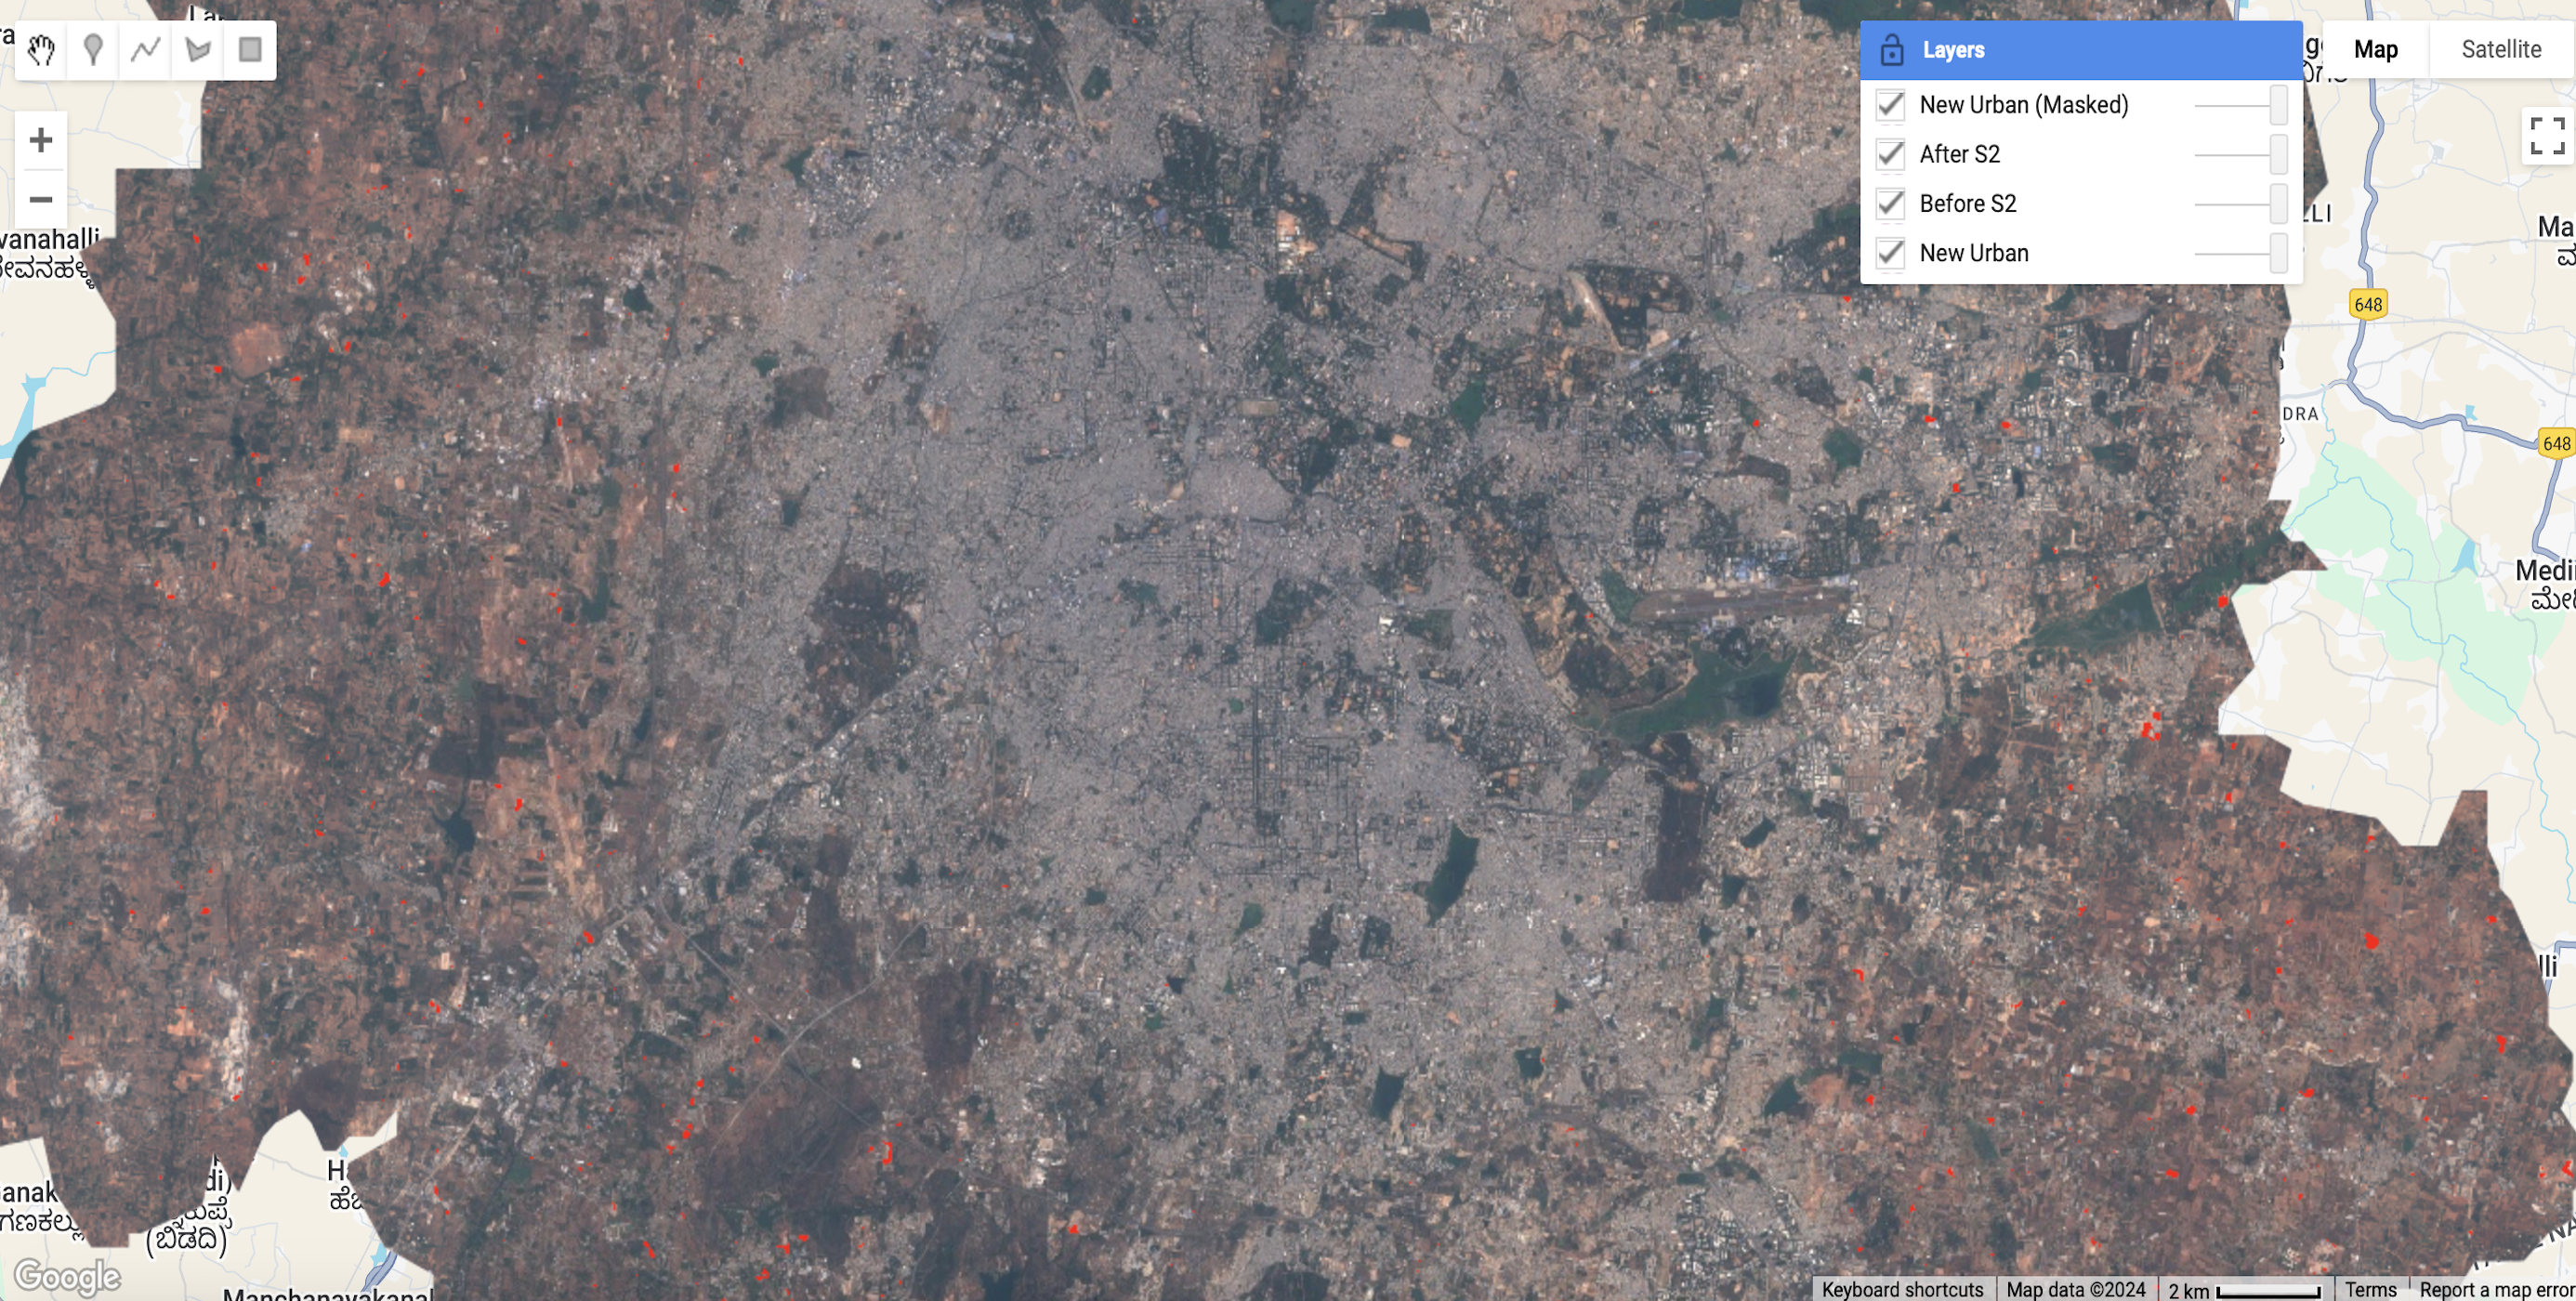
Recently, I explored the Dynamic World App, which is a great example of how to use Google Earth Engine (GEE) for interactive applications. Instead of focusing on analysis in GEE, this guide will show how to refactor code and add UI components to create an interactive app.
The objectives for a GEE app might include:
- Displaying key information such as methodology, datasets, and references.
- Adding tools to control the map frame, like selecting an area, adjusting opacity, or changing dates.
- Integrating visualizations and charts for specific regions or points, often with time-series data.
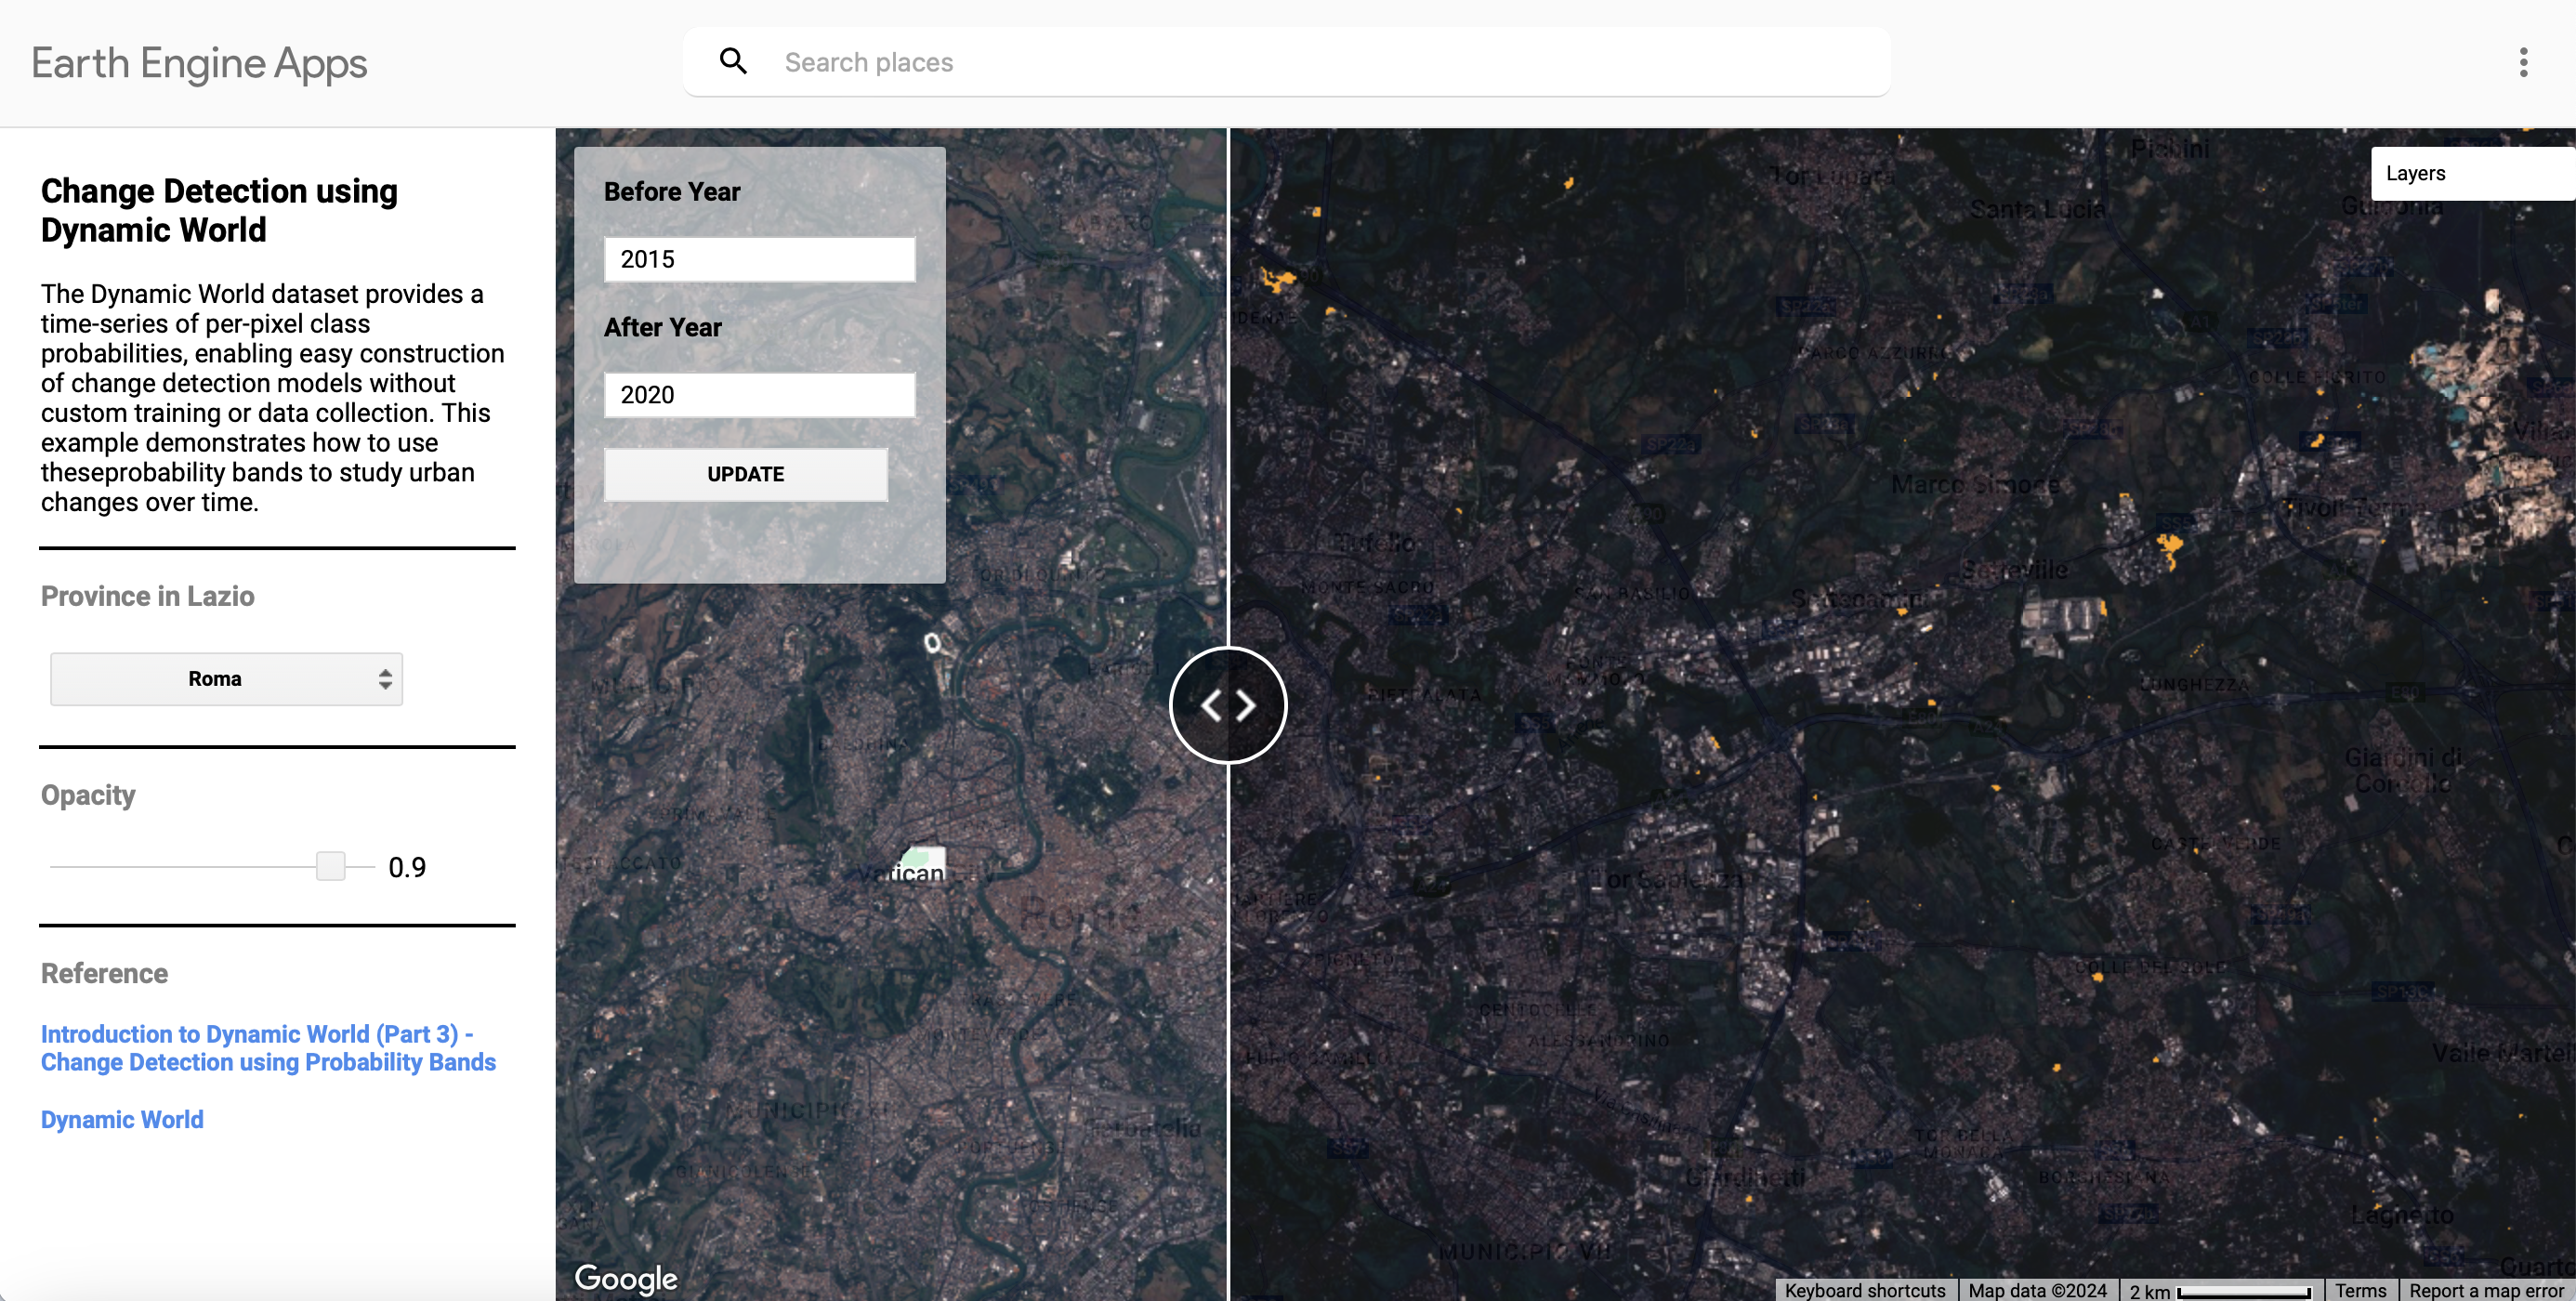
For this tutorial, we will use Change Detection Using Probability Bands as the base. You can find the original scripts. The app will allow users to:
- Select provinces within the Lazio region.
- Set “before” and “after” years for change detection.
- Adjust the opacity of Sentinel imagery.
- View descriptive information.


View the app here and access the full scripts here.
Step 1 Refactor the Code
To start, divide the scripts into smaller, reusable sub-functions. This makes the code more organized and highlights which functions rely on inputs that can be made interactive. This structure will also simplify the process of updating the app based on user input.
// Function to filter province geometry by province name.
function getProvinceGeometry(provinceName) {
  return admin2.filter(ee.Filter.eq('ADM2_NAME', provinceName)).geometry();
}

// Filter Dynamic World Collection
function getDynamicWorldBuiltCollection(geometry) {
  return ee.ImageCollection('GOOGLE/DYNAMICWORLD/V1')
    .filterBounds(geometry)
    .select('built');
}

// Create Mean Composite
function createMeanComposite(dwCollection, startDate, endDate) {
  return dwCollection.filterDate(startDate, endDate).mean();
}

// Detect New Urban Areas
function detectNewUrban(beforeDw, afterDw) {
  return beforeDw.lt(0.2).and(afterDw.gt(0.5));
}

// Filter Sentinel-2 Collection
function getSentinel2Collection(geometry) {
  return ee.ImageCollection('COPERNICUS/S2')
    .filterBounds(geometry)
    .select(commonBands)
    .filter(ee.Filter.lt('CLOUDY_PIXEL_PERCENTAGE', 35));
}

// Create Median Composite
function createMedianComposite(s2Collection, startDate, endDate) {
  return s2Collection.filterDate(startDate, endDate).median();
}

// Add Layer to Map
function addLayerToMap(map, image, visParams, layerName, geometry) {
  map.addLayer(image.clip(geometry), visParams, layerName);
}
Step 2 Create a Split Panel Visualization
The app will use GEE’s Split Panel to compare two maps side by side:
- Left panel: Displays the satellite image from the “before” period.
- Right panel: Shows the change in built-up areas overlaid on the “after” satellite image.
To create this:
- Create two separate maps.
- Add layers to each map.
- Link the maps to synchronize their views.
- Add the maps to a Split Panel layout.
// Map configuration
var beforeMap = ui.Map();
var afterMap = ui.Map();
beforeMap.centerObject(geometry, 12);
afterMap.centerObject(geometry, 12);

// Add layers to before map
addLayerToMap(beforeMap, beforeS2, s2beforeVisParams, 'Before S2', geometry);

// Add layers to after map
addLayerToMap(afterMap, afterS2, s2afterVisParams, 'After S2', geometry);
addLayerToMap(afterMap, newUrban.selfMask(), changeVisParams, 'New Urban (After)', geometry);

// Link the maps for synchronized movement
var linker = new ui.Map.Linker([beforeMap, afterMap]);

// Create a split panel
var splitPanel = ui.SplitPanel({
  firstPanel: beforeMap,
  secondPanel: afterMap,
  orientation: 'horizontal',
  wipe: true,
});
Step 3 Add Interactive Controls
Interactive controls make the app dynamic, allowing users to update the map based on their selections. We’ll wrap the logic from Step 1 into an updateMaps() function to refresh the display with new inputs. Additionally, we’ll reset map layers with Map.layers().reset() each time.
// Update Maps
function updateMaps(provinceName, beforeYear, afterYear) {
  beforeMap.layers().reset();
  afterMap.layers().reset();

  var geometry = getProvinceGeometry(provinceName);

  var beforeStart = ee.Date.fromYMD(ee.Number.parse(beforeYear), 1 , 1);
  var beforeEnd = beforeStart.advance(1, 'year');
  var afterStart = ee.Date.fromYMD(ee.Number.parse(afterYear), 1 , 1);
  var afterEnd = afterStart.advance(1, 'year');

  // Dynamic World Processing
  var dw = getDynamicWorldBuiltCollection(geometry);
  var beforeDw = createMeanComposite(dw, beforeStart, beforeEnd);
  var afterDw = createMeanComposite(dw, afterStart, afterEnd);
  var newUrban = detectNewUrban(beforeDw, afterDw);

  // Sentinel-2 Processing
  var s2 = getSentinel2Collection(geometry);
  var beforeS2 = createMedianComposite(s2, beforeStart, beforeEnd);
  var afterS2 = createMedianComposite(s2, afterStart, afterEnd);

  // Add layers to maps
  addLayerToMap(beforeMap, beforeS2, s2beforeVisParams, 'Before S2', geometry);
  addLayerToMap(afterMap, afterS2, s2afterVisParams, 'After S2', geometry);
  addLayerToMap(afterMap, newUrban.selfMask(), changeVisParams, 'New Urban (After)', geometry);

  // Center maps on geometry
  beforeMap.centerObject(geometry, 12);
  afterMap.centerObject(geometry, 12);
}
Area Selector
We’ll use ui.Select() to create a dropdown menu of Lazio’s provinces. Each time the selection changes, trigger the updateMaps() function with Selector.onChange().
// Admin Polygons
var admin2 = ee.FeatureCollection('FAO/GAUL_SIMPLIFIED_500m/2015/level2');
var areas = admin2.filter(ee.Filter.eq('ADM1_NAME', 'Lazio')).aggregate_array('ADM2_NAME');

// Selector
var provinceSelector = ui.Select({
  items: areas.getInfo(),
  placeholder: 'Select a province',
  value: 'Roma',
  style: {width: '200px', fontSize: '15px', padding: '5px'}
})

// Event Listener
provinceSelector.onChange(function(newProvince) {
  updateMaps(newProvince, beforeyearText.getValue(), afteryearText.getValue());
});
Before and After Year Input
To allow custom date ranges, we’ll use ui.Textbox() widgets for user input. Two textboxes will let users specify the “before” and “after” years. To prevent unnecessary computations, we use a ui.Button() to confirm the inputs before triggering the update function.
Validation is crucial here. To ensure valid inputs, use a validateYear() function linked to a feedback label. Validation rules, such as chronological order or range constraints, are applied when the user clicks the submit button.
// Textboxes and submit button
var beforeyearText = ui.Textbox({placeholder: '2015', value: '2015'});
var afteryearText = ui.Textbox({placeholder: '2020', value: '2020'});
var submitButton = ui.Button({label: 'UPDATE', style: {width: '153px'}})

 // Validation Feedback
var feedbackLabel = ui.Label('', {
  fontSize: '12px',
  margin: '0 auto',
  width: '150px',
  backgroundColor: 'rgba(255, 255, 255, 0)'
});

 // Function to validate the input dates
function validateYear() {
  var beforeYear = Number(beforeyearText.getValue());
  var afterYear = Number(afteryearText.getValue());
  // Clear feedback label and reset style to red by default
  feedbackLabel.setValue('');
  feedbackLabel.style().set('color', 'red');
  // Check if all dates are valid
  if (beforeYear < '2015') {
    feedbackLabel.setValue('Before Year should be no earlier than 2015.');
    return false;
  }
  if (afterYear > ee.Date(Date.now()).get('year').getInfo()) {
    feedbackLabel.setValue('After Year should be no later than the current year.');
    return false;
  }
  // Check chronological order
  if (beforeYear > afterYear) {
    feedbackLabel.setValue('Before Year should be earlier than After Year.');
    return false;
  }
  // If all checks pass, show success message in green
  return true;
}

// Event Listener
submitButton.onClick(function() {
  if (validateYear()) {
    updateMaps(provinceSelector.getValue(), beforeyearText.getValue(), afteryearText.getValue());
    }
})
Opacity Slider
The last interactive component is opacity control. An opacity slider using ui.Slider() will let users adjust the visibility of satellite imagery. This control is especially useful for comparing new built-up areas with the basemap (Google Maps).
var opacitySlider = ui.Slider({
  min: 0,
  max: 1,
  value: 1,
  style: {width: '240px', fontSize: '15px', padding: '5px'}
});

// Event Listener
opacitySlider.onChange(function(value) {
  beforeMap.layers().get(0).setOpacity(value);
  afterMap.layers().get(0).setOpacity(value);
});
Step 4 Combine Panels
Year Selection Panel
We’ll create a semi-transparent panel to mimic the style of the Dynamic World App. This panel will contain the textboxes, a submit button, and descriptive labels. Add it to the left map panel using beforeMap.add(yearPanel). To improve aesthetics, use beforeMap.setControlVisibility() to disable unnecessary default buttons.
// Year Selection Panel
var yearPanel = ui.Panel({
  widgets: [
    ui.Label('Before Year', {fontWeight: 'bold', backgroundColor: 'rgba(255, 255, 255, 0)'}),
    beforeyearText,
    ui.Label('After Year', {fontWeight: 'bold', backgroundColor: 'rgba(255, 255, 255, 0)'}),
    afteryearText,
    feedbackLabel,
    submitButton
  ],
  style: {position: 'top-left', height: '235px', width: '200px', backgroundColor: 'rgba(255, 255, 255, 0.6)',}
});
Split Panel Adjustments
We’ll slightly adjust the split panel from Step 2 by removing location-sensitive components like centerObject(). These will be refreshed dynamically in the updateMaps() function. Add the year selection panel to the left map and clean up the default widgets.
var beforeMap = ui.Map();
var afterMap = ui.Map();
beforeMap.add(yearPanel).setControlVisibility({all:false});
afterMap.setControlVisibility({mapTypeControl:false, fullscreenControl:false});

var linker = new ui.Map.Linker([beforeMap, afterMap]);

var splitPanel = ui.SplitPanel({
  firstPanel: beforeMap,
  secondPanel: afterMap,
  orientation: 'horizontal',
  wipe: true,
});
Info Panel
Finally, create an information panel to display a title, introduction, and references. Use a ui.Panel() with a divider to structure this content. Add it alongside the interactive controls for a cohesive layout.
// Horizontal Black Line (divider)
function createDivider() {
  return ui.Panel(null, null, {border: '1px solid black', margin: '8px auto', width: '95%'});
}

// Info Panel
var infoPanel = ui.Panel({
  widgets: [
    ui.Label('Change Detection using Dynamic World', {fontSize: '18px', fontWeight: 'bold'}),
    ui.Label('The Dynamic World dataset provides a time-series of per-pixel class '+
    'probabilities, enabling easy construction of change detection models without '+
    'custom training or data collection. This example demonstrates how to use these'+
    'probability bands to study urban changes over time.'),
    createDivider(),
    ui.Label('Province in Lazio', {fontSize: '15px', color: 'grey', fontWeight: 'bold'}),
    provinceSelector,
    createDivider(),
    ui.Label('Opacity', {fontSize: '15px', color: 'grey', fontWeight: 'bold'}),
    opacitySlider,
    createDivider(),
    ui.Label('Reference', {fontSize: '15px', color: 'grey', fontWeight: 'bold'}),
    refOne,
    refTwo
  ],
  style: {width: '300px', padding: '15px'}
});
Step 5 App Initialization
To complete the app:
- Call the
updateMaps()function to render the map with default parameters. - Combine the
infoPanelandsplitPanelinto a root panel. - Display the app by attaching the root panel to the UI.
updateMaps(provinceSelector.getValue(), beforeyearText.getValue(), afteryearText.getValue());

ui.root.clear();
ui.root.add(ui.Panel({
  widgets: [infoPanel, splitPanel],
  layout: ui.Panel.Layout.flow('horizontal'),
  style: {stretch: 'both'}
  })
);